
How to Generate Flowcharts with AI: Unleash Creativity with Jeda.ai
Let's explore how to generate flowcharts with AI and understand various use cases and benefits of using Jeda.ai. Creating flowcharts has become a breeze.
February 3, 2024
How to Generate Flowcharts with AI: Streamline Visual Communication with Jeda.ai
In today's fast-paced world, effective communication is paramount, especially when dealing with complex ideas, plans, or workflows. Flowcharts serve as a powerful tool to visually represent processes and simplify understanding. With Jeda.ai, an efficient online whiteboard equipped with Generative AI, creating flowcharts becomes a breeze. In this blog post, we will explore how to generate a flowchart with AI and understand various use cases and benefits of using Jeda.ai.
Understanding Jeda.ai and its Features:
Before diving into the process of generating a flowchart, it is important to familiarize ourselves with the capabilities of Jeda.ai. This online whiteboard incorporates Generative AI to generate interactive content, such as diagrams, wireframes, sticky-notes, artwork, and more. Its user-friendly interface and AI-powered commands make it an ideal platform for creating flowcharts effortlessly.
Why do we need a flowchart?
Flowcharts are graphical representations that use symbols and shapes to depict the sequence of steps, processes, or activities within a system or a process. They provide a visual representation of the flow of information, materials, or actions clearly and concisely.
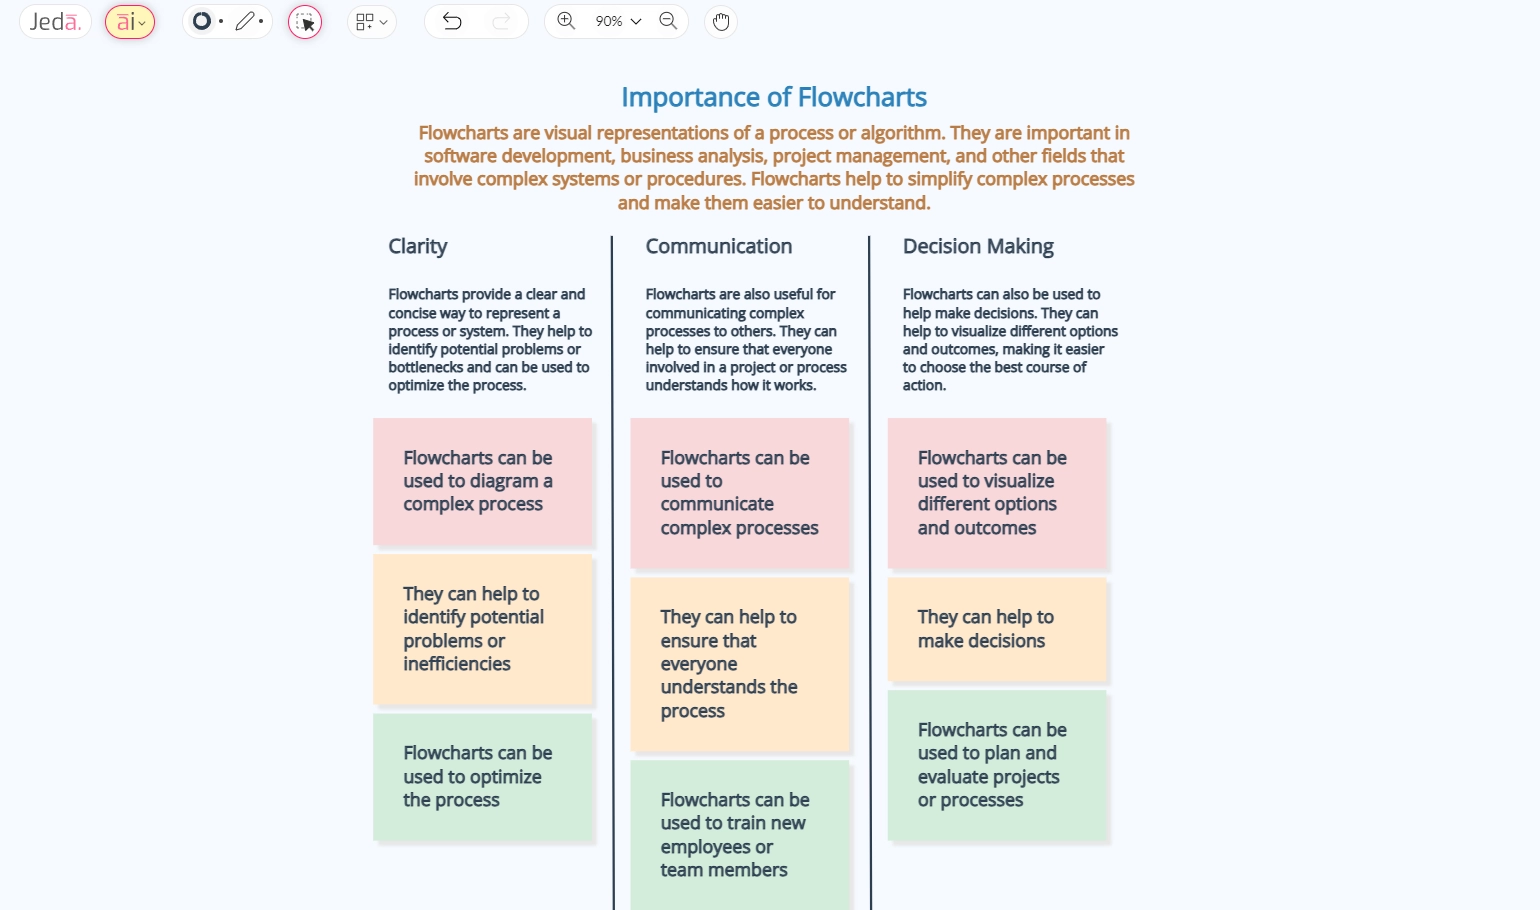
Here are several reasons why flowcharts are beneficial:
1.Clarity and Understanding:
Flowcharts make complex processes easier to understand by breaking them down into simple, sequential steps. Visual representation helps individuals, whether they are experts or beginners, grasp the overall process quickly.
2.Communication:
Flowcharts serve as a universal language that can be easily understood by people across different departments or disciplines. They facilitate effective communication between team members, stakeholders, and other involved parties.
3.Problem Identification and Resolution:
Flowcharts can help identify bottlenecks, inefficiencies, or potential issues in a process. Analyzing the flow of steps can highlight areas where improvements or optimizations can be made.
4.Documentation:
Flowcharts provide a visual documentation of processes, making it easier to maintain and update procedures. They serve as a reference point for employees to understand and follow specific procedures.
5.Decision-Making:
Flowcharts can be used as decision-making tools, helping individuals understand the consequences of different choices within a process. They provide a structured approach to decision points and outcomes.
6.Training:
Flowcharts are useful for training purposes, especially for new employees or those unfamiliar with a particular process. They serve as a visual aid to guide individuals through the steps of a process.
7.Quality Control:
Flowcharts can be employed for quality control purposes, ensuring that processes are executed consistently and according to predefined standards.
8.Project Planning:
In project management, flowcharts help plan and visualize the flow of tasks, dependencies, and milestones. They assist in understanding the overall project structure and timeline.
9.Standardization:
Flowcharts promote standardization by providing a common understanding of how a process should be executed. This can lead to greater consistency and efficiency in operations.
10.Auditing and Compliance:
Flowcharts are useful in audits and compliance assessments by providing a clear representation of processes. They help ensure that processes adhere to regulatory requirements and standards.
In summary, flowcharts are versatile tools that enhance communication, understanding, and analysis of processes in various fields, contributing to improved efficiency and problem-solving.
Benefits of Using Flowcharts

1. Visual Representation:
Flowcharts provide a visual representation of complex processes, making it easier for stakeholders to understand and communicate ideas and concepts.
2. Efficiency and Optimization:
By visualizing a process, flowcharts enable organizations to identify bottlenecks or inefficiencies, allowing them to make necessary adjustments and improve overall efficiency.
3. Collaboration:
Flowcharts facilitate collaboration among team members by providing a common framework for discussing and improving processes.
Overall, flowcharts provide a valuable tool for analyzing, communicating, improving, and documenting processes and procedures within various domains.
Use Cases of Flowcharts
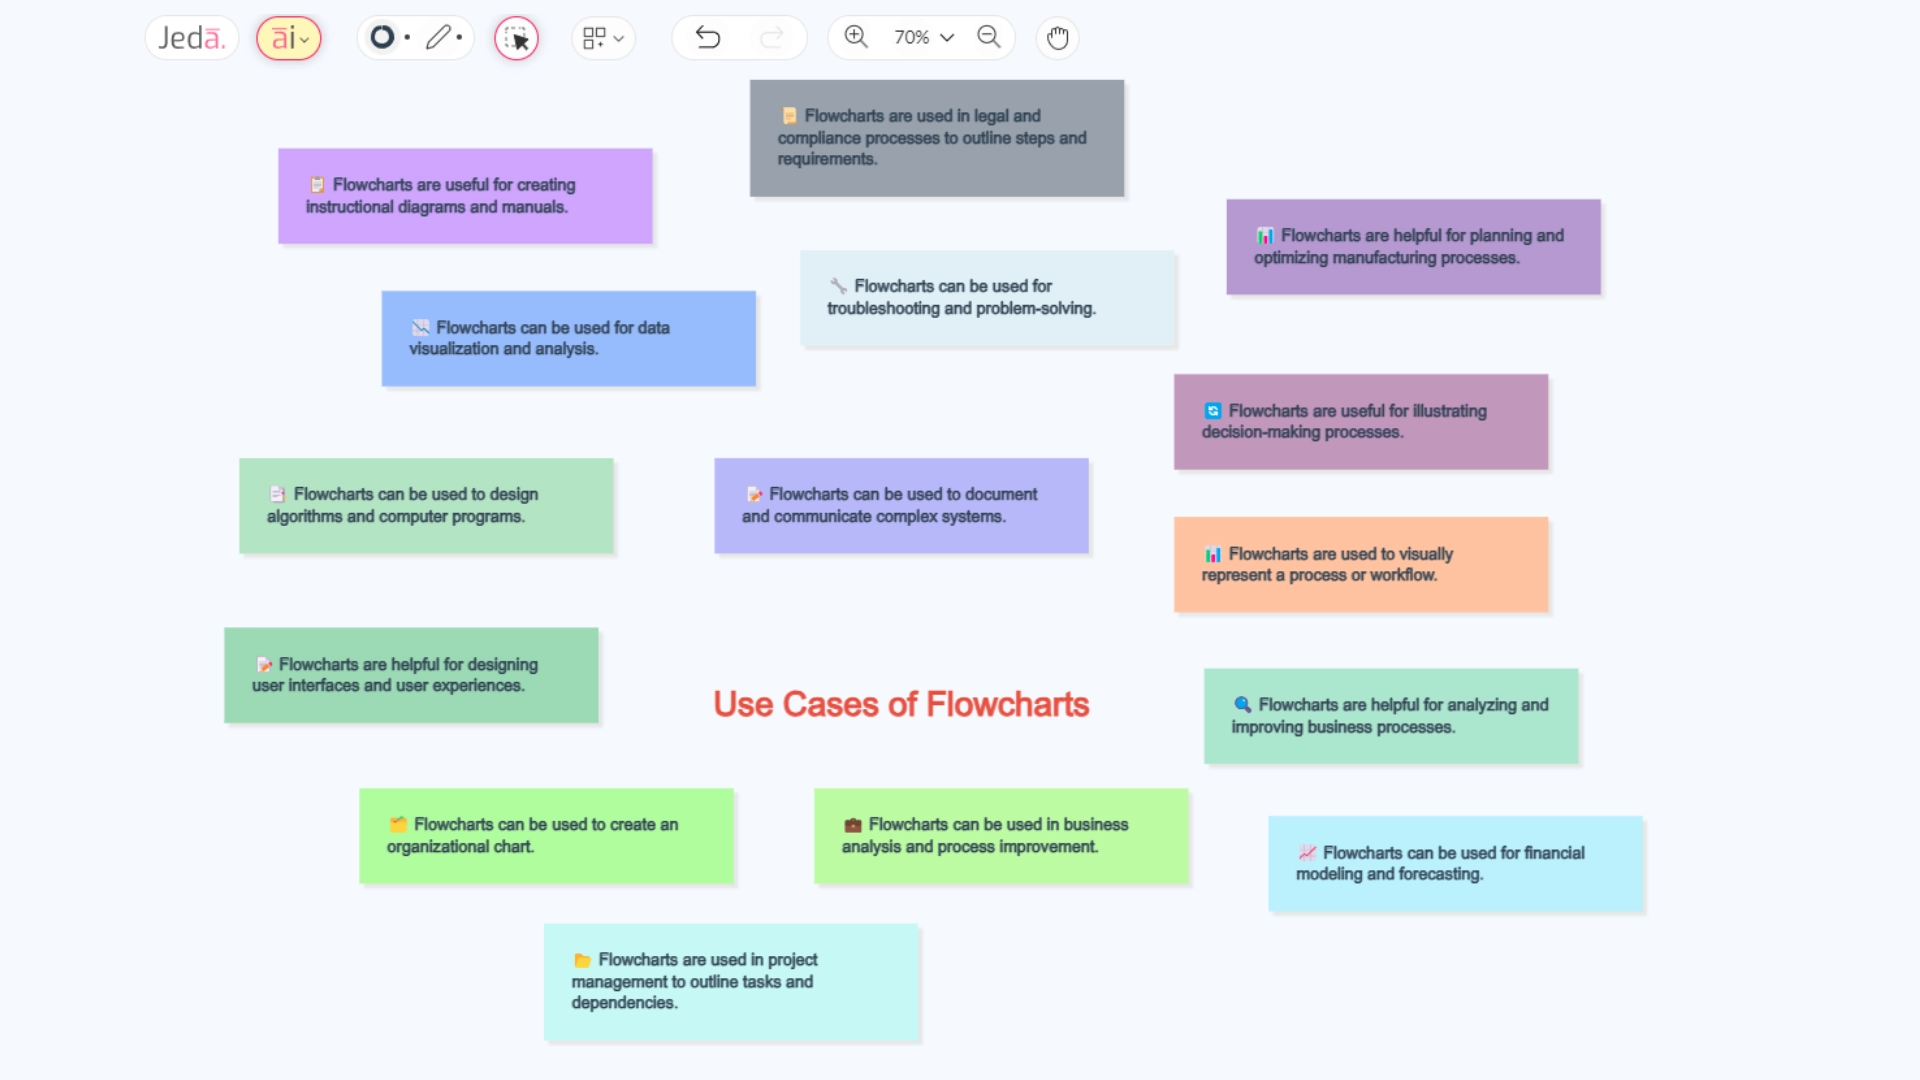
1. Process Documentation:
Flowcharts are immensely valuable for documenting complex processes. Whether it's illustrating a step-by-step procedure, outlining decision paths, or mapping out dependencies, flowcharts provide a comprehensive visual representation.
2. Project Management:
Flowcharts aid in project planning by visually depicting tasks, timelines, and dependencies. They provide clarity on the project's scope, highlight potential bottlenecks, and facilitate efficient resource allocation.
3. Troubleshooting and Decision-Making:
Flowcharts are indispensable when it comes to troubleshooting processes or making complex decisions. By mapping out various scenarios and potential outcomes, flowcharts enable individuals to navigate through decision points systematically.
4. Training and Onboarding:
Flowcharts simplify training and onboarding processes by visually breaking down complex workflows. New employees can easily follow the flowchart and understand their roles, tasks, and interactions within the broader context.
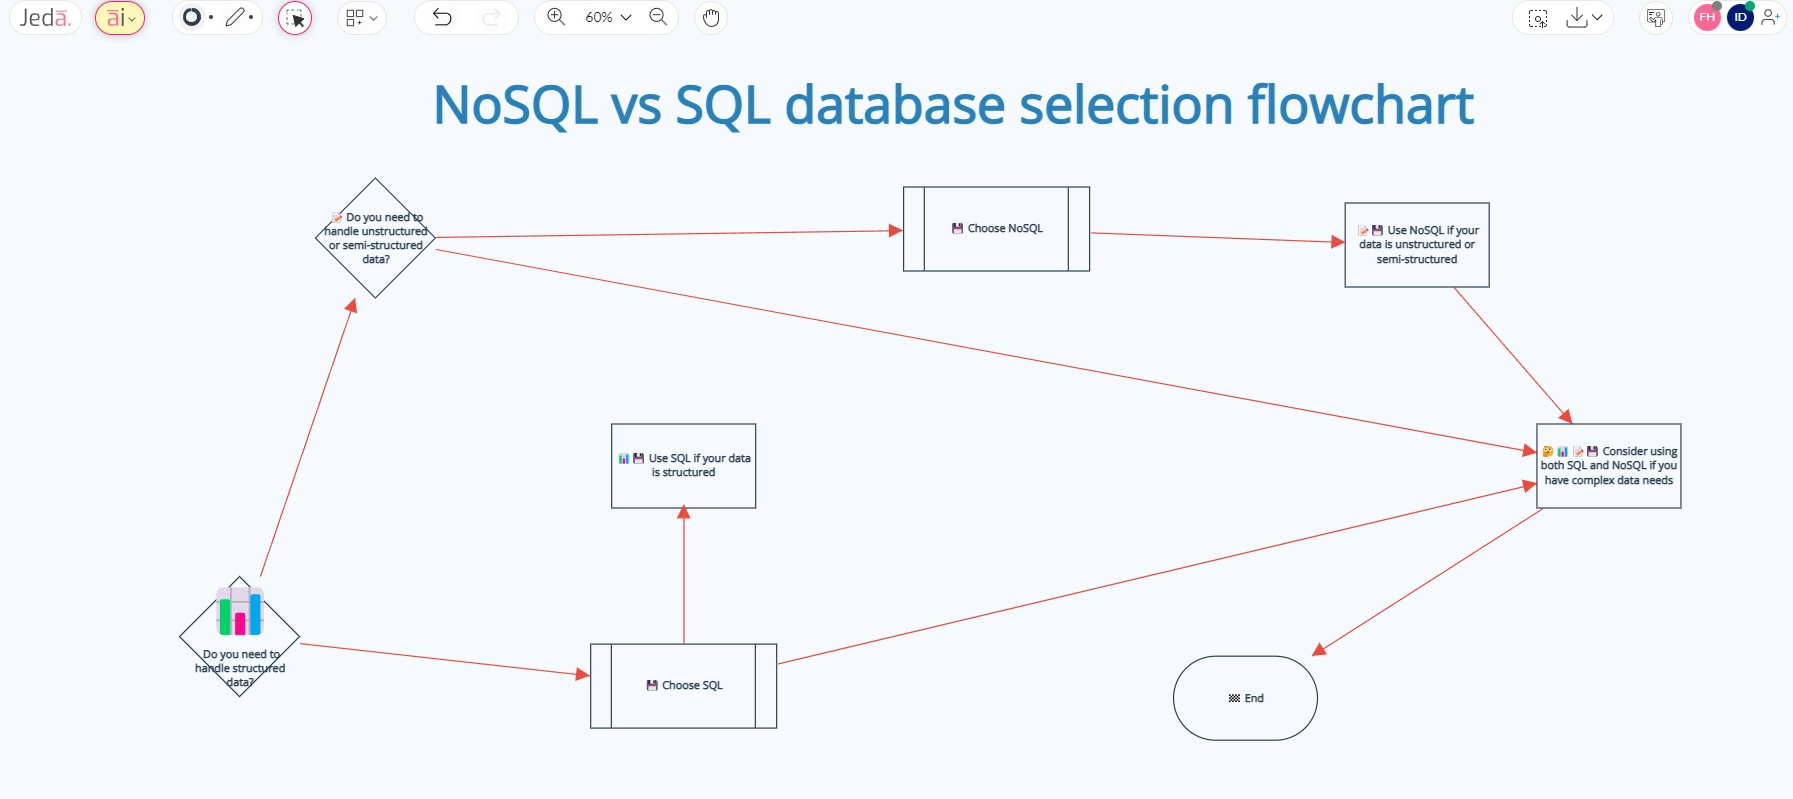
Types of Flowcharts
Flowcharts are versatile visual representations used to illustrate processes, workflows, and system interactions. Different types of flowcharts serve specific purposes and are utilized in various industries.
Here are some common types of flowcharts:
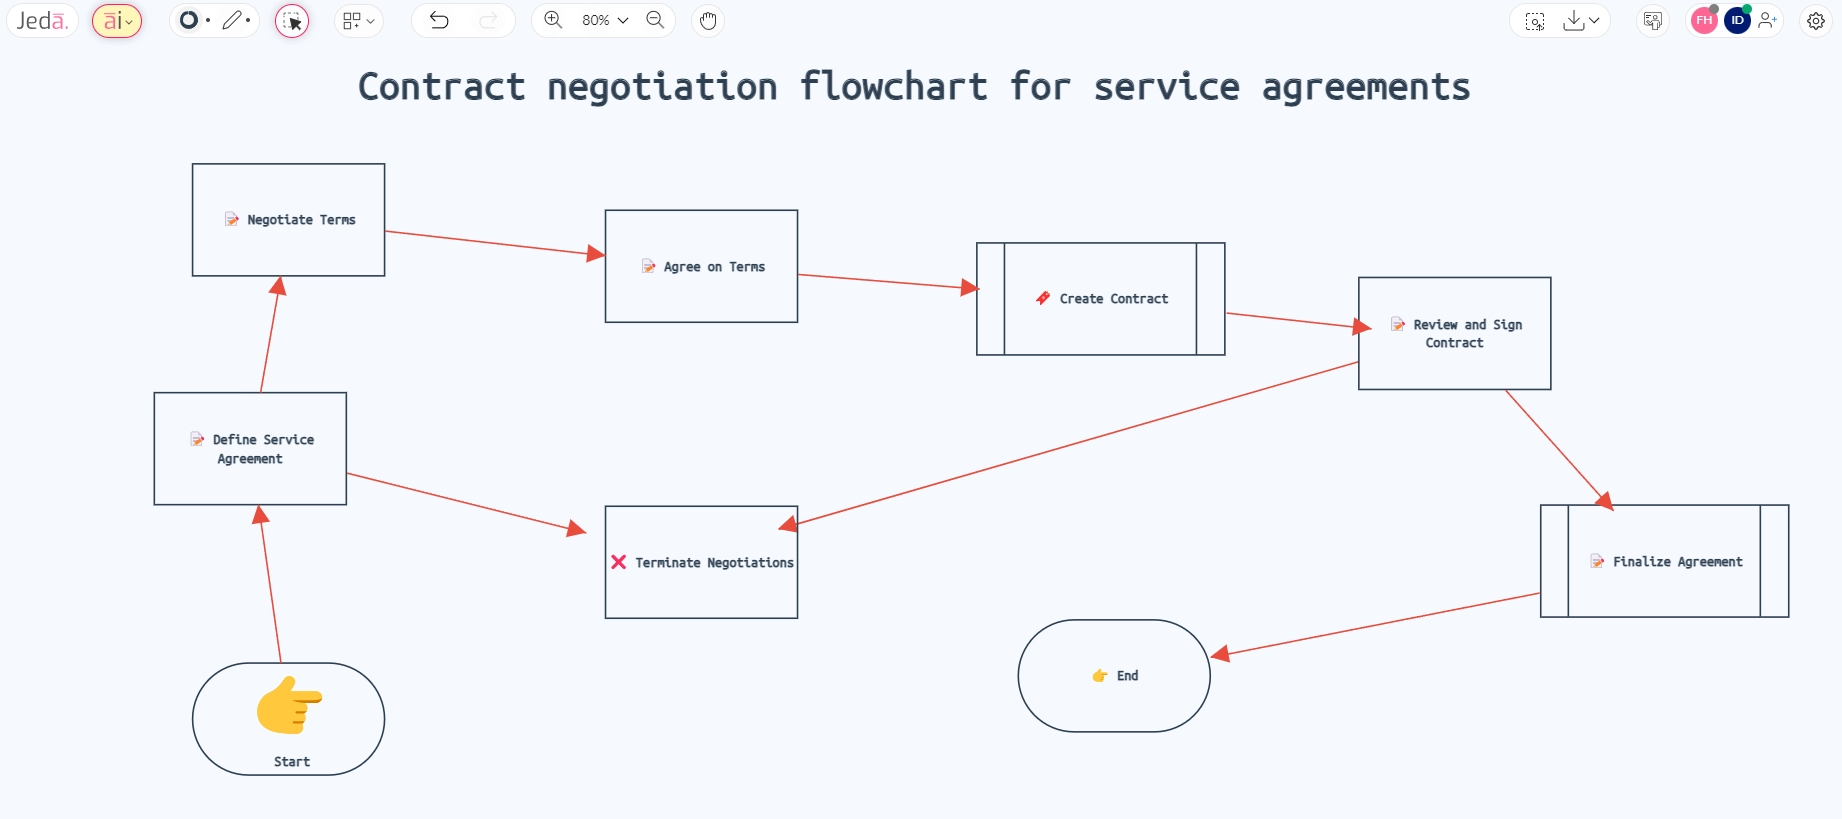
Process Flowchart
A Process Flowchart is a visual representation illustrating the sequence of tasks and decision points within a specific process. It delineates the steps, activities, and interactions, providing a clear overview of the workflow. Commonly used in business, manufacturing, and project management, it aids in process analysis and optimization.
Workflow Diagram
A Workflow Diagram visually depicts the sequence and relationships of tasks within a specific job role or department. It highlights the flow of work, emphasizing task dependencies, decision points, and interactions. Commonly used for process optimization, project management, and understanding the overall structure of workflows within an organization.
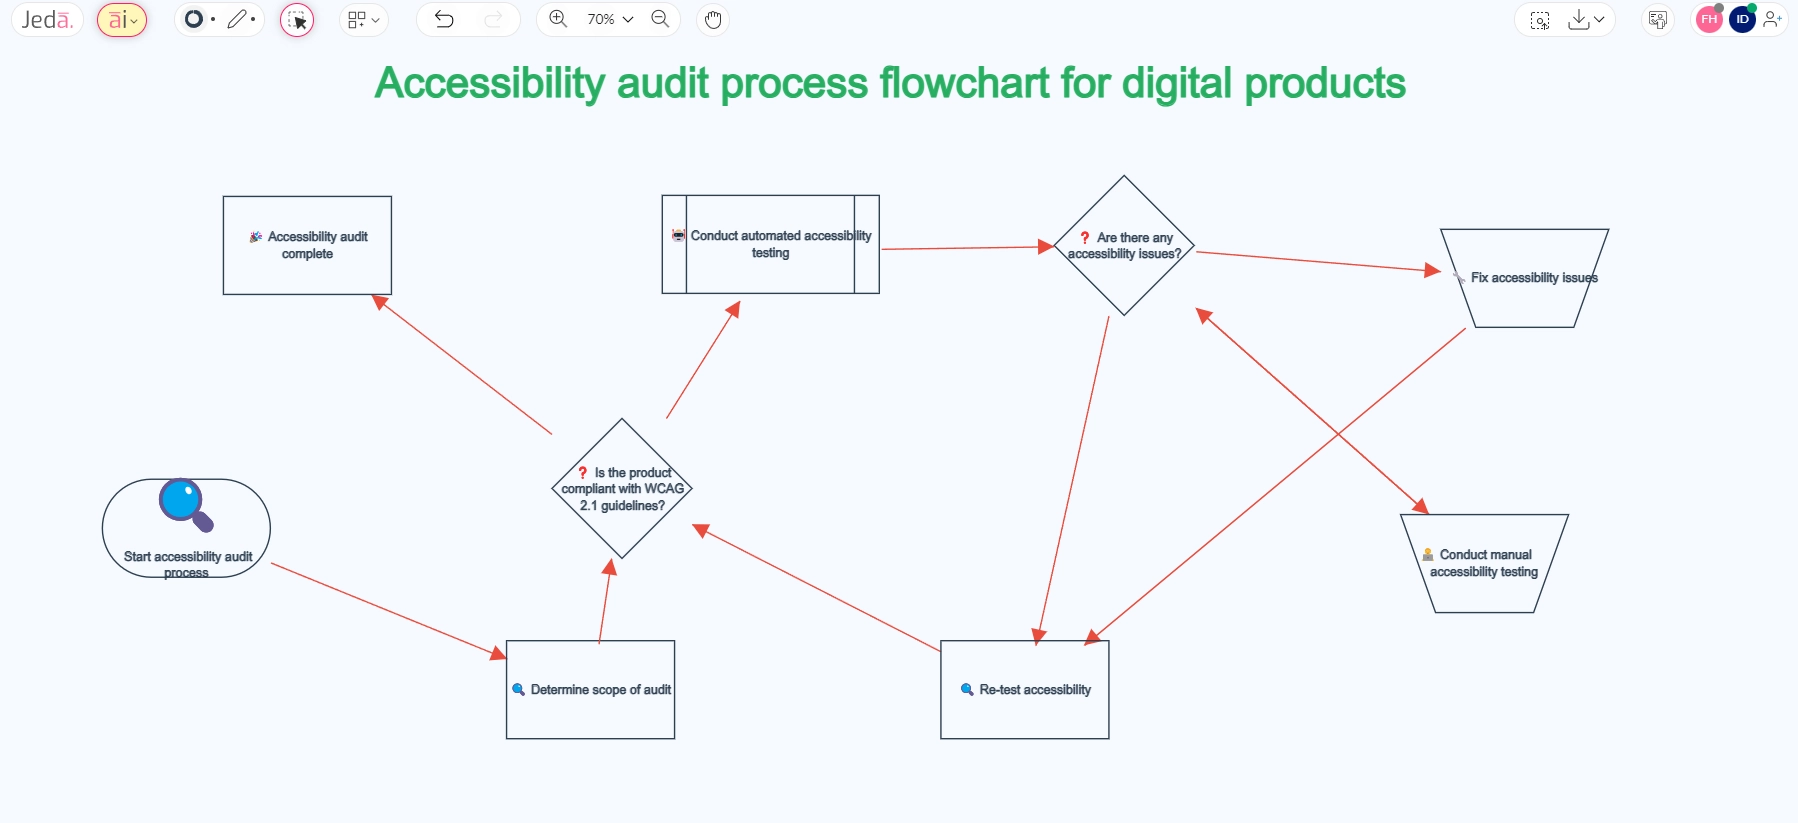
Audit Flowchart
An Audit Flowchart is a visual representation that outlines the steps and procedures involved in conducting an audit. It provides a structured overview of the audit process, including key activities, decision points, and interactions between auditors and the components being audited. Typically, audit flowcharts detail the sequence of audit tasks, starting from the planning phase to the issuance of the final audit report. They are valuable tools for ensuring a systematic, organized, and thorough examination of financial or operational processes, enhancing transparency and communication within the audit team.
Data Flow Diagram (DFD)
A Data Flow Diagram (DFD) is a visual representation of how data moves within a system. It illustrates the flow of information between processes, data stores, and external entities. DFDs use symbols to represent these components, providing a clear overview of the data flow and interactions within a system. They are commonly used in system analysis and software development to understand, document, and improve data processes.

Swimlane Flowchart (Cross-Functional Flowchart)
A Swimlane Flowchart is a visual representation of a process that divides the flowchart into "lanes" or sections, each representing different entities or departments. It illustrates the interactions and responsibilities between various participants in a process. Swimlane flowcharts are effective for showing how tasks move between different stakeholders or functional areas, providing clarity in complex workflows and improving collaboration.

Decision Tree
A Decision Tree is a visual representation that depicts decision points and the potential outcomes of decisions through branches and nodes. It's used to model and analyze decision-making processes, showing different paths based on choices made. Decision Trees are valuable in various fields, including business, finance, and machine learning, for assessing complex scenarios and optimizing decision strategies.
System/Program Flowchart
A System Flowchart is a visual representation that outlines how a system processes input data, performs operations, and generates output. It illustrates the flow of information and activities within a system, highlighting components such as input, processing, storage, and output. System Flowcharts are crucial in understanding and documenting the architecture and functionality of complex systems in areas like software development and information technology.

Deployment Flowchart
A Deployment Flowchart is a visual representation that illustrates the steps involved in deploying system components within a network or hardware infrastructure. It shows the relationships and interactions between different elements of a system during the deployment process. Deployment Flowcharts are commonly used in software development and IT to ensure the efficient and organized implementation of system components.

Document Flowchart
A Document Flowchart is a visual representation that illustrates the flow of documents, information, or data through various processes or departments within an organization. It provides a detailed overview of how documents move from one step to another, identifying key activities, decision points, and individuals responsible for handling the documents. Document Flowcharts are useful in streamlining administrative processes and improving document management workflows.
EPC Flowchart
An Event-Driven Process Chain (EPC) Flowchart is a type of flowchart that focuses on modeling business processes, emphasizing events and their relationships. EPCs are often used in business process engineering and enterprise resource planning.
%20Flowchart.webp)
Here are key features:
Events: Represent triggers or occurrences that initiate a process.
Functions/Processes: Depict activities or actions within the process.
Connectors: Show relationships and dependencies between events and functions.
Control Flows: Indicate the sequence in which events and functions occur.
Logical Operators: Include connectors like AND, OR, and XOR to represent different conditions or paths in the process.
EPCs provide a comprehensive view of business processes, emphasizing the cause-and-effect relationships between events and activities. They are effective in analyzing, optimizing, and communicating complex business processes within an organization.
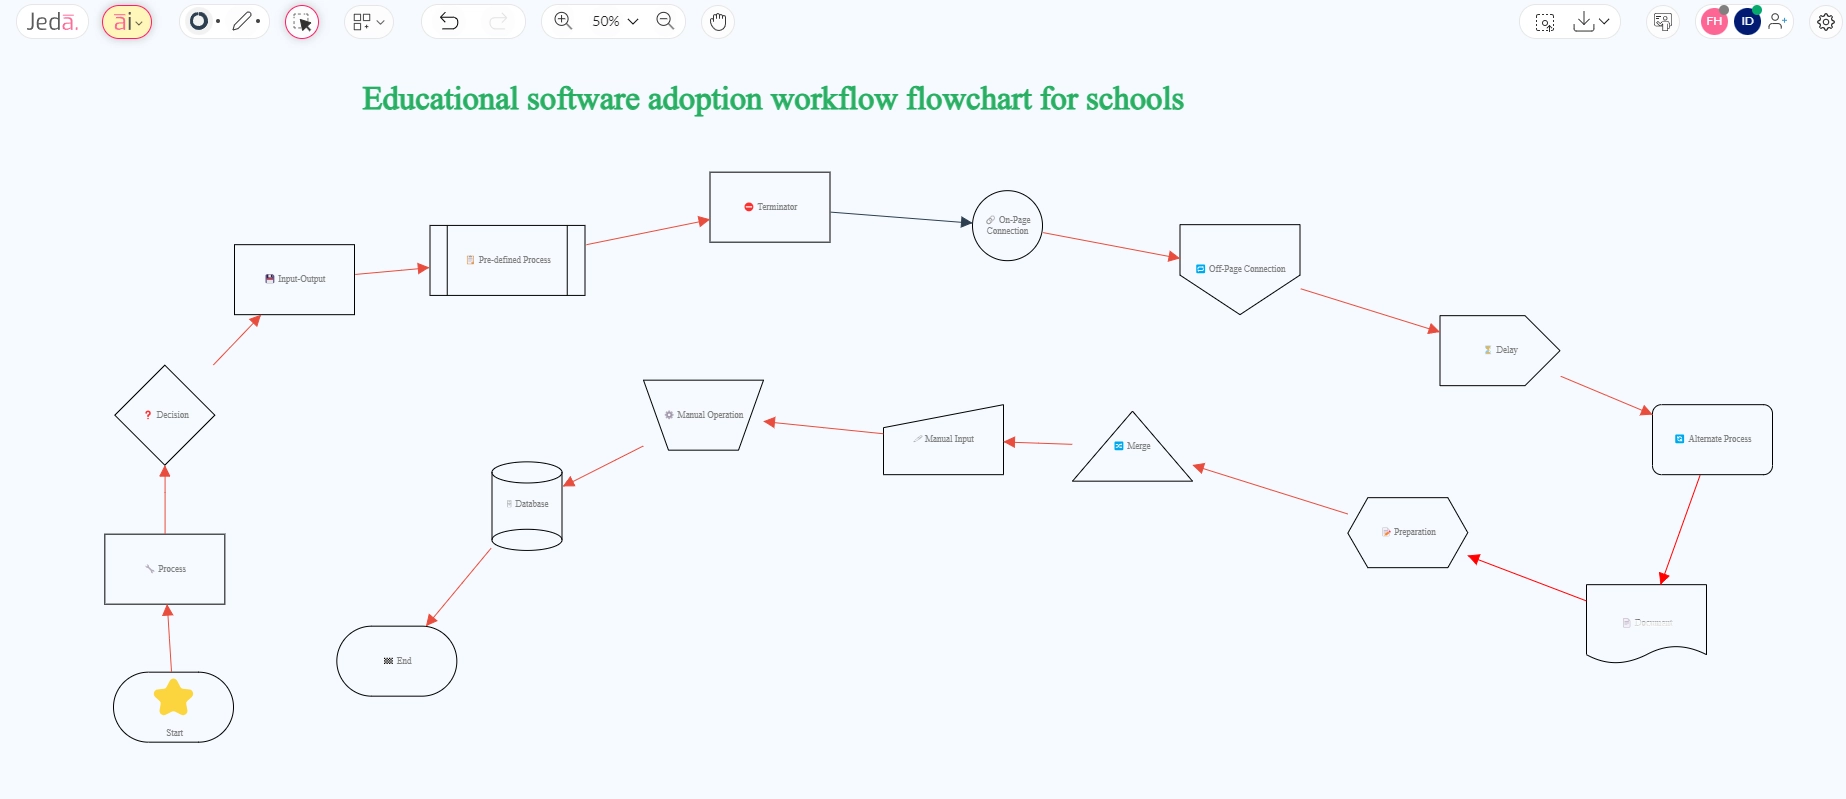
Explaining The Shapes of A Flowchart
Flowcharts use different shapes to represent different elements or steps in a process.
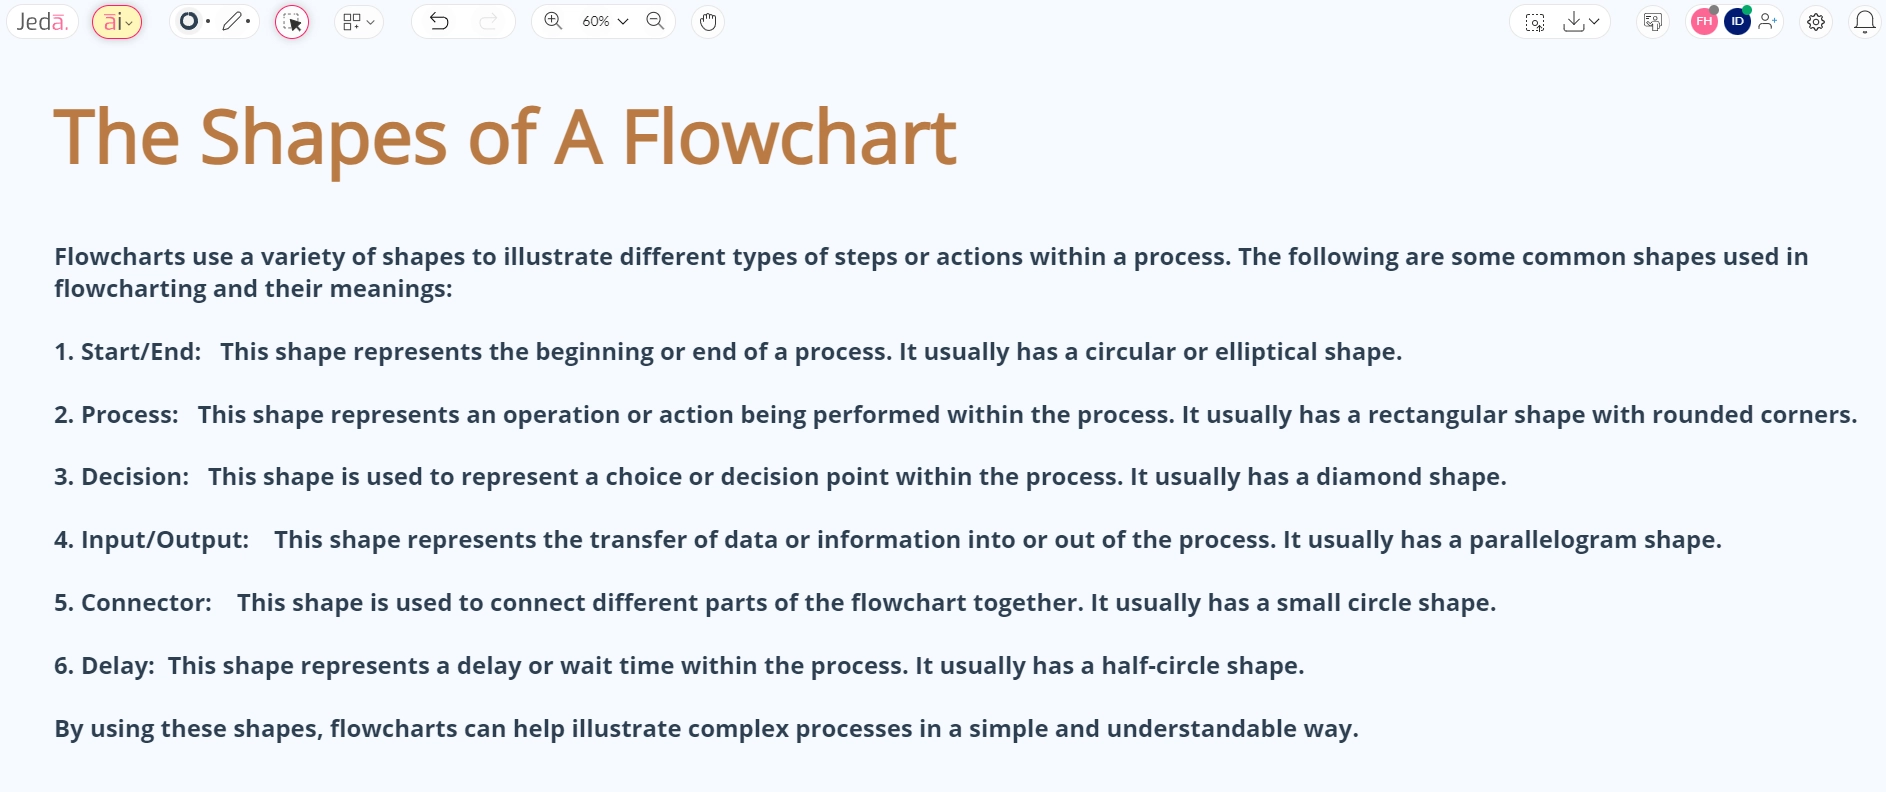
Here are some common flowchart shapes and their explanations:
Oval (Terminator):
Represents the start or end of a process. Used at the beginning and end of a flowchart.
Rectangle (Process):
Represents a specific action or operation in the process. This is where tasks are carried out.
Diamond (Decision):
Represents a decision point in the process. The process flow can take different paths based on a condition or decision.
Parallelogram (Input/Output):
Represents input or output of data. Used to signify data entry, display, or storage.
Circle/Rounded Rectangle (Connector):
Represents a connection point in the flowchart where the process continues on another part of the page or to another page.
Rounded Rectangle with Double Lines (Terminator within a subprocess):
Indicates the start or end of a process within a subprocess or a separate flowchart.
Document (Data or Report):
Represents a document or report in the process, often used to denote data storage or documentation.
Rectangle with Wavy Base (Delay):
Represents a delay or waiting period in the process.
Rectangle with Double Vertical Lines (Predefined Process):
Indicates a predefined process or subroutine. It represents a set of operations defined elsewhere in the flowchart.
Cylinder (Database):
Represents database operation or data storage. Used to signify actions involving databases.
Rectangle with Trapezoid (Manual Operation):
Represents a manual operation or user action. Used to denote tasks performed manually by a person.
These shapes are interconnected using arrows to represent the flow or sequence of actions in the process. The arrows show the direction of the process, and decision points (diamonds) determine the path based on certain conditions. Using these standardized shapes and symbols helps make flowcharts universally understandable and aids in clear communication of processes and workflows.
Why should you use Jeda.ai to create flowcharts?
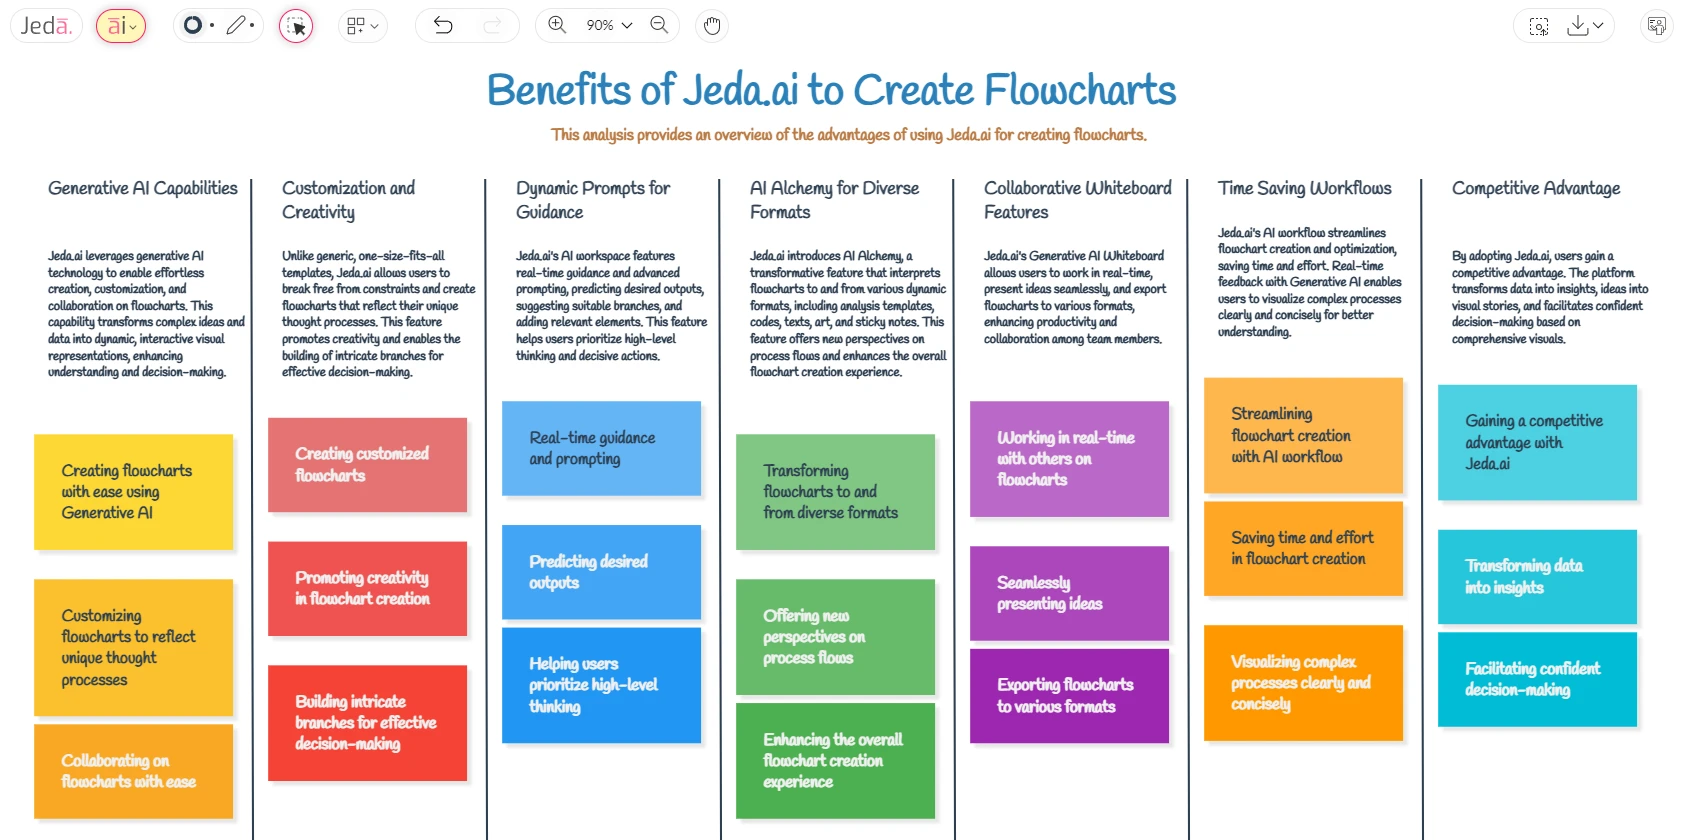
Generative AI Capabilities
Jeda.ai harnesses the capabilities of Generative AI, enabling users to effortlessly create, customize, and collaborate on flowcharts. This technology transforms complex ideas and data into dynamic, interactive visual representations, enhancing understanding and decision-making.
Customization and Creativity
Unlike generic, one-size-fits-all templates, Jeda.ai allows users to break free from constraints. Creativity knows no bounds, as individuals can create, customize, and shape flowcharts reflective of unique thought processes, building intricate branches for effective decision-making.
Dynamic Prompts for Guidance
The AI workspace features real-time guidance and advanced prompting. It predicts desired outputs, suggests suitable branches, and adds relevant elements, helping users prioritize high-level thinking and decisive actions.
AI Alchemy for Diverse Formats
Jeda.ai introduces AI Alchemy, a transformative feature that effortlessly interprets flowcharts to and from various dynamic formats. From analysis templates, codes, and texts to art and sticky notes, this multi-dimensional experience offers new perspectives on process flows.
Collaborative Whiteboard Features
Jeda.ai’s Generative AI Whiteboard elevates collaboration, allowing users to work in real-time. Presenting ideas seamlessly and exporting flowcharts to various formats enhances productivity and collaboration among team members.
Time Saving Workflows
Jeda.ai's AI workflow streamlines flowchart creation and optimization, saving time and effort. Real-time feedback with Generative AI enables users to visualize complex processes clearly and concisely for better understanding.
Competitive Advantage
By adopting Jeda.ai, users gain a competitive advantage. The platform transforms data into insights, ideas into visual stories, and facilitates confident decision-making based on comprehensive visuals.
How to generate flowcharts with Jeda.ai?

Generate Flowcharts with AI Recipes
Jeda.ai's AI Recipes is an excellent option when you're not sure where to start. It's an effortless process that follows these simple steps:
1. Start by logging into your Jeda.ai account. From your Dashboard, you'll have the option to create a fresh Workspace.
2. Once in the Workspace, navigate to the AI Menu located at the top right corner. Under Diagrams, select Basic Diagram or Flowchart.
3. Respond to a few intuitive questions related to your necessity or project. When you're done, hit “Generate”.
Generate a Flowchart with AI Slash Commands
If you're comfortable with quick commands and prefer a hands-on approach, you might prefer Jeda.ai's slash commands. Here's how you can use our AI slash commands to generate Flowcharts:
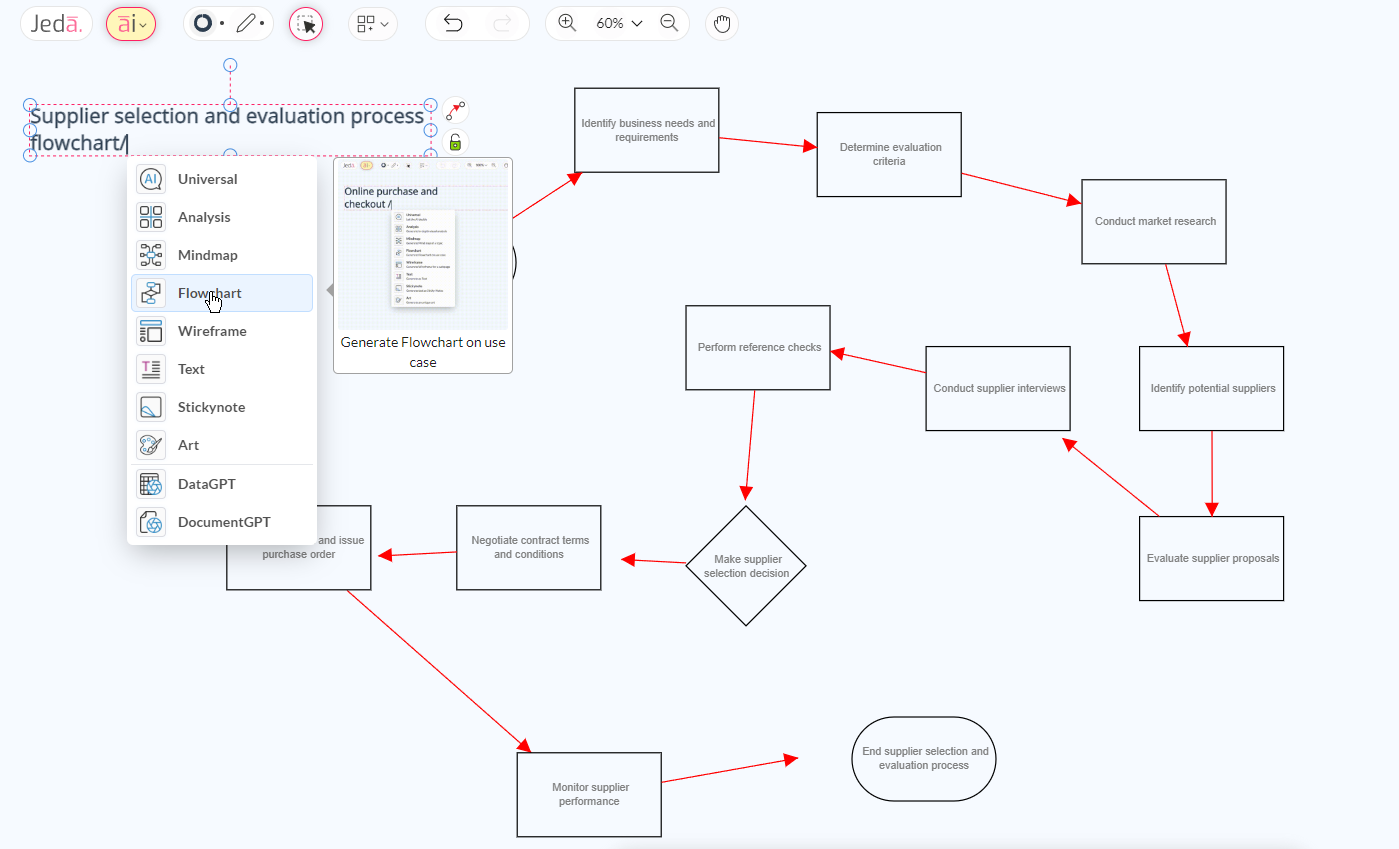
1. After logging in, enter your Workspace of choice.
2. On the AI Online Whiteboard, type the query about your desired flowchart. For example, you might want to try: "Supplier selection and evaluation process flowchart".
3. Simply put a forward slash (/) after your query, and a list of available AI commands will appear. Select "Flowchart" to initiate the AI-powered Flowchart creation process.
Generate Flowcharts with AI Command Bar

For a more guided approach that still gives you a lot of control, you can use Jeda.ai's AI Command Bar. Here are the steps:
1. Sign in and select your desired Workspace.
2. Towards the bottom, you'll see the AI Command Bar. Use it to select the "Flowchart" command. Then type in your required Flowchart query.
3. You may want to go with our prepopulated dynamic prompts offered by the AI to fuel your creativity.
4. Whether you are using a dynamic prompt or creating your unique one, you'll notice a DP button next to your query. This button offers granular tuning options to customize your Flowchart further.
5. When you're satisfied with your prompts and parameters, just hit "Generate".
Conclusion
Visual communication is incredibly powerful, and flowcharts play a vital role in conveying complex ideas with ease. Jeda.ai's Generative AI empowers users to effortlessly generate flowcharts, streamlining the communication process. By following the step-by-step guide provided in this blog post, you can create visually appealing flowcharts using Jeda.ai for various purposes, including process documentation, project management, troubleshooting, and training. Generate flowcharts with AI and revolutionize the way you communicate ideas and concepts.

